
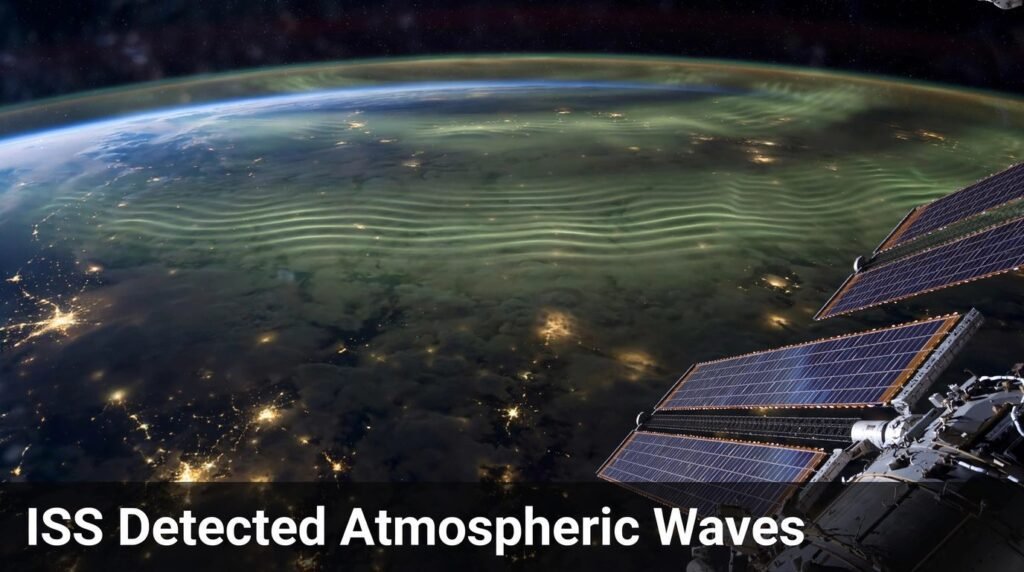
Look up on a clear night and the sky seems calm. It is not. High above the clouds, in a thin layer of air roughly 85 kilometres above your head, the atmosphere is rippling like the surface of a pond after a stone has been thrown in. You cannot see those ripples with the naked eye. They are too faint, too high, and too fast. But the International Space Station can. When the ISS detected atmospheric waves, it opened a new window on the upper atmosphere.
When the ISS detected atmospheric waves, it did something no ground telescope could do quite as well. Flying about 400 kilometres above Earth, circling the planet roughly every 90 minutes, the station looked down at a faint glow in the upper atmosphere and watched those ripples pass in real time. NASA’s instruments on board turned that glow into images, and those images turned a quiet corner of atmospheric science into one of the most talked-about parts of space weather research.
This is not a story about one strange night. It is a story about a connection scientists had suspected for decades and could finally measure properly: weather down here shapes conditions up there, and the waves in between carry the message. The proof arrived the day the ISS detected atmospheric waves above a major storm.
The short answer: The ISS detected atmospheric waves mainly by watching airglow, the faint light given off by gases in the upper atmosphere, with instruments such as NASA’s Atmospheric Waves Experiment (AWE) and the Near Infrared Airglow Camera (NIRAC). The waves are mostly atmospheric gravity waves, ripples set off by storms, hurricanes and wind flowing over mountains. They travel upward into the mesosphere and beyond, where they can disturb the ionosphere, affect satellite drag, and interfere with GPS and radio signals. The clearest proof came from extreme events, including Hurricane Helene in September 2024 and the Hunga Tonga eruption of January 2022, whose waves circled the globe several times.
What Are Atmospheric Waves, Exactly?
Atmospheric waves are organised disturbances that travel through the air. Think of them less like ocean waves crashing on a beach and more like ripples spreading through a vast, layered sea of gas. Air is pushed up, gravity pulls it back down, and the overshoot creates an oscillation. That oscillation can travel sideways for hundreds or even thousands of kilometres, and upward through layer after layer of the atmosphere. Understanding them is the first step to understanding how the ISS detected atmospheric waves.
Most of the waves the ISS studies are not the familiar waves you see in a weather forecast. They are smaller in scale than the great swirling systems that bring rain, yet their effects reach far higher than any storm cloud. A thunderstorm in Texas can, in a real sense, shake the air 85 kilometres above it. That is the part that surprised many people outside the field — and it is exactly what the station was built to observe. That surprise is part of why the ISS detected atmospheric waves became such a talked-about result.
Gravity waves are the main characters
The term that matters most here is atmospheric gravity wave. The name can confuse people, because it sounds like it belongs in astrophysics. It does not. These waves have nothing to do with black holes or colliding neutron stars. They are a wholly terrestrial phenomenon, driven by gravity acting as a restoring force on displaced air. These are the waves at the heart of how the ISS detected atmospheric waves.
Here is the simple version. A parcel of air gets pushed upward, perhaps by a thunderstorm’s updraft or by wind forced over a mountain range. As it rises into thinner air, it becomes heavier than its surroundings relative to its new position, so gravity pulls it back down. It overshoots, rises again, and falls again. The result is a bobbing motion that propagates outward as a wave, carrying energy and momentum with it.
Scientists describe these waves by their size. Their horizontal wavelengths generally range from tens to thousands of kilometres, and their vertical wavelengths are typically several kilometres. At mid-latitudes, their periods can run from several minutes to about a day. Individually, many are small. Together, they help drive the circulation of the middle atmosphere, influence the winds of the stratosphere, and even play a role in phenomena such as the quasi-biennial oscillation and the breakdown of the polar vortex.
How are gravity waves different from other atmospheric waves?
Not every ripple in the sky is a gravity wave. The atmosphere supports several kinds of wave motion, and telling them apart matters because they behave differently and carry different information. Sorting them out is part of the work that began when the ISS detected atmospheric waves.
- Atmospheric gravity waves: Driven by buoyancy and gravity. Set off by storms, convection, and wind over mountains. They can travel from the lower atmosphere all the way to the edge of space.
- Lamb waves: A special kind of acoustic-gravity wave that travels along the surface of the Earth at roughly the speed of sound, around 318 metres per second at surface level in the Tonga case. They can circle the globe.
- Planetary waves, also called Rossby waves: Much larger, slower waves linked to the rotation of the Earth and the great north-south temperature differences. They shape weather patterns over days and weeks.
- Atmospheric tides: Regular daily rhythms driven by the Sun heating the atmosphere, strongest in the upper atmosphere.
- Gravitational waves: Ripples in space-time itself, caused by accelerating massive objects. They travel at the speed of light and have nothing to do with weather. The similar name causes endless confusion, so it is worth separating them clearly.
The ISS work focuses mainly on the first group, with Lamb waves entering the story whenever an event is powerful enough to launch them, as the Tonga eruption was.
| Wave type | What drives it | Typical scale | Why it matters |
|---|---|---|---|
| Atmospheric gravity wave | Storms, mountains, convection | Tens to thousands of km across | Carries energy upward, disturbs the ionosphere |
| Lamb wave | Powerful explosions and eruptions | Global | Circles the Earth, can trigger distant effects |
| Planetary (Rossby) wave | Earth’s rotation, temperature contrasts | Thousands of km | Shapes large-scale weather patterns |
| Atmospheric tide | Solar heating | Global, daily cycle | Affects upper-atmosphere winds and density |
| Gravitational wave | Accelerating massive objects in space | Cosmic | Ripples in space-time, not weather |
Why Do Atmospheric Waves Matter?
It is fair to ask why anyone should care about faint ripples 85 kilometres up. The answer is practical, not just academic. Those ripples are a delivery system. They move energy and momentum from the weather layer, the troposphere, into the stratosphere, the mesosphere, and the thermosphere. When they arrive, they can change winds, temperatures, and the density of the air at heights where satellites fly.
That matters for three reasons. First, satellite drag depends on air density. When waves stir the upper atmosphere, density changes, and a satellite’s orbit can decay faster or slower than predicted. Second, radio and GPS signals pass through the ionosphere, the electrically charged layer above the mesosphere. When gravity waves disturb the ionosphere, signals can scintillate, fade, or arrive with small timing errors. Third, weather and climate models need to represent these waves correctly. If a model ignores them, or gets their strength wrong, its forecasts for the upper atmosphere, and increasingly for the surface too, will drift.
There is also a deeper scientific reason. For a long time, space weather was treated as something that came from the Sun: solar flares, coronal mass ejections, and the solar wind. The results from when the ISS detected atmospheric waves showed that a meaningful part of space weather comes from below, from Earth itself. Storms, hurricanes, and eruptions on the ground can reach into space. That changed how researchers think about the whole system, from the ground up.
How the ISS Detected Atmospheric Waves
The station’s advantage is its position. It flies low enough to look closely at the upper atmosphere, high enough to see it from above, and it passes over most of the populated world as it orbits. Ground stations can watch one patch of sky. A satellite in a high polar orbit can cover the globe but may pass over a given place only once or twice a day. The ISS, circling every 90 minutes or so, gets repeated looks at the same regions under different conditions. Those repeated looks are how the ISS detected atmospheric waves night after night.
But position alone is not enough. The waves themselves are invisible in ordinary daylight. The trick is airglow.
What is airglow, and why does it reveal the waves?
Airglow is a faint emission of light from gases in the upper atmosphere. During the day, sunlight energises those gases. At night, chemical reactions keep some of them glowing. The result is a thin, luminous layer, most famously the hydroxyl, or OH, airglow layer around 85 to 87 kilometres up, in the upper mesosphere.
When a gravity wave passes through that layer, it squeezes and stretches the air. Where the air is compressed, the glow brightens. Where it is stretched, the glow dims. From above, that shows up as bands, arcs, and ripples of light and dark, like the pattern on the surface of a pond seen from a bridge. The wave itself is invisible, but its fingerprint on the airglow is not. That fingerprint is how the ISS detected atmospheric waves.
This is why the ISS instruments work mainly at night, in infrared light. The airglow signal is clearest then, and infrared sensors can pick out the hydroxyl emission even when the human eye would see nothing. A single image shows the pattern at one moment. A sequence of images, taken seconds apart, shows the pattern moving, growing, and breaking.
Astronaut photography: the human eye in orbit
Long before dedicated instruments arrived, astronauts were already photographing these patterns. Since the switch to digital cameras in 2004, handheld photography from the ISS has built a vast archive of Earth imagery, covering land, oceans, and atmosphere. Astronauts have captured gravity waves made visible in clouds, dust, and airglow, often by chance while photographing storms or sunsets.
Those photographs matter for two reasons. A trained observer in orbit can react to something unusual in real time, pointing a camera at a storm or a wave pattern a fixed instrument might miss. And the photographs give the public something an instrument readout cannot: a picture of the phenomenon that anyone can understand at a glance. Many of the most striking gravity wave images you will have seen — long, parallel cloud ripples stretching to the horizon — come from this archive.
Astronaut photography has limits, though. It depends on who is awake, where the station is, and whether the light is right. For systematic science, NASA needed instruments that watch continuously, in the same way, night after night. That is where AWE and NIRAC come in.
What Instruments on the ISS Actually Do the Detecting?
The ISS detected atmospheric waves with several instruments on board, but two names appear again and again in the research, and one dedicated mission turned the field upside down.
| Instrument | What it measures | Altitude it watches | Key strength |
|---|---|---|---|
| AWE (Atmospheric Waves Experiment) | Infrared airglow, temperature variations | Around 87 km, the mesopause | Continuous global mapping, four images per second |
| NIRAC (Near Infrared Airglow Camera) | OH airglow images at 85–87 km | Upper mesosphere | High-resolution images, motion compensation |
| AMTM (Advanced Mesospheric Temperature Mapper) | Part of AWE, temperature of the airglow layer | Mesopause | Sensitive to small wave details |
| SAGE-III/ISS | Aerosols, ozone, trace gases | Stratosphere and above | Tracks volcanic plumes and wave effects |
| Astronaut cameras | Visible-light Earth imagery | Surface to upper atmosphere | Flexible, human-directed, public images |
NASA’s Atmospheric Waves Experiment (AWE)
AWE is the centrepiece of this story. It launched to the ISS on 9 November 2023 and was installed on the exterior of the station that same month. It was managed by NASA’s Goddard Space Flight Center and built by Utah State University’s Space Dynamics Laboratory, with Ludger Scherliess of Utah State University as principal investigator. It was funded by NASA’s Heliophysics Division and was the first NASA mission designed specifically to study how terrestrial weather affects space weather in this way.
AWE stared down toward Earth and tracked undulations in the airglow using its Advanced Mesospheric Temperature Mapper, a set of telescopes that scan the mesopause, the boundary layer that begins about 87 kilometres up. It captured four infrared images every second, but only at night, when airglow can be seen. Over its 30-month stay on the station, it collected more than 80 million nighttime images. Those four images a second are how the ISS detected atmospheric waves in fine detail.
That volume matters. With that many images, researchers could move from case studies — one storm, one night — to patterns: which waves matter most, where they come from, and how far they travel. One early finding from AWE data was that the gravity waves with the greatest influence on the upper atmosphere have small horizontal wavelengths, ranging from 30 to 300 kilometres, which is exactly the range AWE was designed to measure. That finding came directly from the nights the ISS detected atmospheric waves over storms and hurricanes.
AWE’s data collection phase ended on 21 May, when ground controllers powered the instrument down at the scheduled end of its mission, having surpassed its planned two-year lifetime. The instrument was switched off to make way for another experiment, CLARREO Pathfinder, but its data remain available, including interactive visualisations that paint AWE’s observations onto a globe as the station orbited.
NIRAC and the view from 85 kilometres
The Near Infrared Airglow Camera, NIRAC, works on the same principle but with a different design. It captures high-resolution images of the OH airglow layer in the upper mesosphere, at altitudes around 85 to 87 kilometres, and can identify complex wavelike dynamics and instabilities at that height, including waves over weather fronts that had not been studied in this way before.
Because the ISS moves so fast, about 7.7 kilometres per second, an ordinary camera would smear the image. NIRAC uses a motion compensation system to keep its images sharp despite that speed, and its data can distinguish atmospheric phenomena from surface features, even in cloudy or remote regions. Research using NIRAC, published in the Journal of Geophysical Research: Atmospheres, showed that the camera could reveal previously unstudied atmospheric dynamics over weather fronts. Those dynamics are part of the same story as how the ISS detected atmospheric waves.
SAGE-III and the other eyes on board
SAGE-III/ISS, the Stratospheric Aerosol and Gas Experiment, looks at the atmosphere in a different way, measuring aerosols and trace gases. It played a role after the Tonga eruption, when researchers used SAGE-III/ISS observations alongside other satellite data to track how the volcanic sulphur dioxide cloud spread around the globe. It is a reminder that the ISS does not carry one wave detector. It carries a suite, and the most powerful results come from combining them.
What Did NASA Find When the ISS Detected Atmospheric Waves?
When the ISS detected atmospheric waves, AWE observed atmospheric gravity waves from numerous extreme weather events, and the patterns were not subtle. They were clear, structured, and tied directly to the storm or event below.
That finding answers a question researchers had argued about for years. Models had predicted that gravity waves should reach the upper atmosphere and disturb it. Ground radars had seen pieces of the process. But seeing the whole chain — storm, wave, airglow ripple, ionospheric disturbance — from a single platform, night after night, turned a prediction into an observation. That chain is exactly what researchers hoped to see when the ISS detected atmospheric waves.
The second finding is about scale. The most influential waves are not the biggest ones. They are the smaller ones, with horizontal wavelengths of 30 to 300 kilometres. Those are the waves that carry the most energy into the upper atmosphere, and they are also the hardest to see from the ground or from a high satellite. That is why a dedicated instrument on the ISS, designed for exactly that range, made such a difference.
The third finding is about variety. No two events look quite the same. A hurricane makes a different pattern from a thunderstorm, and a thunderstorm over one region makes a different pattern from a similar storm over another. In one observation, AWE viewed atmospheric gravity waves generated by a thunderstorm in north Texas and found they were smaller and more irregular, with a notable north-south asymmetry, compared with waves created by storms in the same area earlier that month. That kind of detail is what turns a general theory into a working understanding. It is also the kind of detail only possible because the ISS detected atmospheric waves night after night.
The Hurricane Helene Case: Waves 55 Miles Up
If one event made the ISS results famous, it was Hurricane Helene. In late September 2024, Helene slammed into Florida’s Gulf Coast, bringing devastating storm surge and damage on land. At the same time, about 55 miles, or 88 kilometres, above Earth, the ISS detected atmospheric waves in a fascinating pattern in the upper atmosphere.
On 26 September 2024, as Helene made landfall, AWE observed atmospheric gravity waves generated by the hurricane. The instrument recorded concentric bands in the mesosphere, stretching for hundreds of kilometres from the storm zone. In the visualisations NASA released, the curved bands extending to the northwest of Florida, artificially coloured red, yellow, and blue, show changes in brightness in a wavelength of infrared light produced by airglow in the mesosphere.
To a casual reader, that might sound like a curiosity. To a scientist, it was a direct observation of a connection that had previously been inferred. A hurricane, a ground-level weather event, was stirring the thin air at tremendous heights, in real time, while the storm was still raging below. It was the clearest single example yet of how the ISS detected atmospheric waves.
The Helene case also showed why the ISS is the right platform for this work. A ground radar could have watched one location. A high satellite might have passed over hours later. AWE was overhead as the storm hit, watching the airglow ripple as it happened. That timing is what makes the difference between a correlation and a cause.
The Tonga Eruption: Waves That Circled the Globe
The most dramatic case of all did not involve a storm. It involved a volcano.
On 15 January 2022, the Hunga Tonga-Hunga Ha’apai volcano in the South Pacific erupted explosively. The climax came at about 04:14 UTC, and the eruption column rose to more than 50 kilometres, with overshooting tops above 55 kilometres, a record in the satellite era. It was, by several measures, the most explosive volcanic eruption of the past 140 years, and NASA determined it was the largest explosion recorded in the atmosphere by modern instrumentation.
The eruption did not just throw ash into the sky. It launched atmospheric waves that propagated around the world multiple times.
A broad spectrum of waves was triggered by the initial explosion, including Lamb waves propagating at phase speeds of about 318 metres per second at surface level and between 308 and 319 metres per second in the stratosphere, and gravity waves propagating at 238 to 269 metres per second in the stratosphere. Researchers who studied the event in detail, in a paper published in Nature, noted that gravity waves at sub-ionospheric heights had not previously been observed propagating at this speed or over the whole Earth from a single source. The scale of that event is one reason the ISS detected atmospheric waves work drew so much attention.
The plume itself remained a powerful wave source for more than 12 hours. Latent heat release from the plume remained the most significant individual gravity wave source worldwide for that period, producing circular wavefronts visible across the Pacific basin in satellite observations. A single source dominating such a large region is also unique in the observational record.
The ISS detected atmospheric waves from the eruption, and its instruments helped researchers understand what happened next. Using SAGE-III/ISS and other satellite observations, researchers investigated how the volcanic sulphur dioxide cloud spread after the eruption and how it formed sulphuric acid clouds in the stratosphere. It took about 19 to 21 days for the stratospheric sulphur dioxide injections to encircle the globe, carried by a dominant westward jet, and the cloud slowly dispersed over the whole globe within several months.
The Tonga waves were also felt far from the volcano. The pressure wave was measured by weather stations in many locations, including New Zealand, Australia, Europe, and the United Kingdom, and shockwaves were reported to have gone around the Earth as many as four times in Japan and Utah. The eruption was heard more than 2,000 kilometres away in New Zealand, and bangs were heard around Anchorage, Alaska, about 9,300 kilometres away.
Tonga matters for the ISS story because it sets the scale. Most gravity waves are local, tied to a storm or a mountain range. Tonga showed what happens at the extreme end: a single event launching waves that cross the entire planet, from the surface to the ionosphere, and keep going. It also showed why space-based observation is essential. No ground network could have captured that global response in full. Only satellites, including instruments on the ISS, could see it whole. That global view is why the ISS detected atmospheric waves from Tonga mattered so much to researchers.
What Scientists Learn From These Waves
Every time the ISS detected atmospheric waves, the pattern was a measurement. When researchers read the airglow images, they are not just admiring a pattern. They are extracting information about the atmosphere itself.
First, the waves reveal where energy is going. A wave’s wavelength, speed, and direction tell researchers how much momentum it is carrying upward and where that momentum will be deposited when the wave breaks. When a gravity wave breaks, like an ocean wave breaking on a shore, it deposits its energy and changes the winds around it. That process helps drive the circulation of the middle atmosphere.
Second, the waves reveal what is happening below. A wave pattern over a mountain range looks different from one over a thunderstorm. By reading the pattern, researchers can work backward to the source, even when the source itself is hidden by cloud. That makes the ISS a kind of remote weather station for the upper atmosphere.
Third, the waves help test and improve models. Weather and climate models have to represent gravity waves, but the waves are often too small for the model’s grid to resolve directly. Instead, models use approximations, called parameterisations, to estimate their effects. AWE’s data, with its focus on the 30 to 300 kilometre range, gives modellers something solid to test those approximations against. If a model gets the waves wrong, it will get the upper-atmosphere winds wrong too. That is why the measurements made when the ISS detected atmospheric waves are now built into model testing.
Fourth, the waves reveal the coupling between layers. The atmosphere is not a stack of separate boxes. It is one connected fluid, and a disturbance in one layer can affect the next. The ISS observations showed that coupling in action, from the troposphere to the mesopause and into the ionosphere. That coupling is now a central idea in space weather research.
What the data changed in practice
Before AWE, many textbooks treated space weather as a top-down story: the Sun acts, the Earth reacts. After AWE, the story is two-way. The Sun still matters enormously, but the Earth itself is also a source of space weather. That shift has practical consequences for how forecasts are built. A space weather forecast that ignores the weather below will miss part of the signal, especially during hurricane season or after a major eruption.
It also changed what counts as a useful observation. Airglow, once a niche topic for specialists, is now recognised as a practical tool for monitoring the state of the upper atmosphere. The more than 80 million images AWE collected are not just a record of the past. They are a dataset that researchers will mine for years, looking for patterns that were not visible in any single night’s data.
How Atmospheric Waves Affect Satellites and Communications
This is where the science meets everyday life. When the ISS detected atmospheric waves, it also found a practical problem: the same waves that make pretty patterns in airglow can also make life harder for the technology we rely on. The ISS detected atmospheric waves, and suddenly the link between weather below and technology above was impossible to ignore.
Satellite drag and orbit prediction
Satellites in low Earth orbit, including the ISS itself, fly through the thin upper reaches of the atmosphere. The density of that air is not constant. It changes with solar activity, with the time of day, and with the passage of gravity waves. When a wave passes, it can compress the air locally, increasing drag, or stretch it, reducing drag. Over hours and days, those small changes add up.
For satellite operators, that matters because orbit prediction depends on drag. If the density is higher than expected, a satellite will lose altitude faster than planned. If it is lower, it will stay up longer. For most satellites, the error is small. For precise work, such as collision avoidance or re-entry prediction, small errors can matter a great deal. Better wave data means better density forecasts, which means better orbit forecasts.
GPS, navigation, and radio signals
GPS signals travel from satellites in medium Earth orbit down to receivers on the ground, passing through the ionosphere on the way. The ionosphere is a layer of charged particles, and its density affects how fast a radio signal travels. When gravity waves disturb the ionosphere, they create ripples in that density. A GPS signal passing through a ripple can arrive slightly early or slightly late, or its strength can fluctuate, a phenomenon called scintillation.
For a phone finding a restaurant, a small error does not matter. For a surveyor measuring a boundary, an aircraft landing in poor visibility, or a farmer guiding a tractor by GPS, it can. The same applies to other radio systems that rely on the ionosphere, including some long-distance communications and over-the-horizon radar. The ISS results do not mean GPS is unreliable. They mean that one source of its occasional errors is now better understood, and can be modelled more accurately. That understanding grew directly out of the way the ISS detected atmospheric waves.
What this means for space weather forecasting
Space weather forecasting is still a young field compared with ordinary weather forecasting. A terrestrial weather forecast draws on thousands of ground stations, weather balloons, aircraft, and satellites. A space weather forecast has far fewer inputs, and the upper atmosphere is harder to observe directly.
The ISS work adds a new input: a continuous, global picture of gravity wave activity at the mesopause. Forecasters can use that picture to anticipate when the ionosphere is likely to be disturbed, even when the Sun is quiet. That is the most important practical lesson of the AWE mission. Space weather is not only about solar storms. It is also about Earth storms, and the ISS can see them coming from above.
- Satellite operators: Better density forecasts mean better orbit predictions and fewer surprises.
- Navigation users: Better ionospheric models mean fewer GPS glitches during disturbed periods.
- Radio operators: Knowing when the ionosphere is rippled helps explain signal fades and dropouts.
- Climate modellers: Better gravity wave data means better long-term models of the middle atmosphere.
How to Watch for Atmospheric Waves Yourself
You cannot see airglow with the naked eye from your garden, and you cannot watch AWE’s infrared images in real time from your phone. But you can follow the story of how the ISS detected atmospheric waves as a skywatcher and a reader, and you can recognise the visible signs when they do appear.
Look for gravity waves in clouds
The most accessible sign is in ordinary clouds. When gravity waves pass through a cloud layer, they can create long, parallel bands, sometimes called cloud streets or wave clouds. From the ground, they look like ripples in the sky. From the ISS, they look like corduroy. Astronaut photographs have captured these patterns over oceans, deserts, and mountain ranges. If you see a sky full of evenly spaced, parallel cloud bands, you may be looking at a gravity wave made visible.
Follow NASA and university releases
NASA and Utah State University have released visualisations of AWE data that paint the observations onto a globe or a map as the station orbits. Those visualisations are the closest most people will get to seeing the airglow ripples directly. They are also a good way to learn which events researchers are studying now, from hurricane season to major thunderstorms.
Know what to look for after big events
After a major hurricane, a severe tornado outbreak, or a large volcanic eruption, watch for news about upper-atmosphere effects. The pattern from Helene and Tonga is now familiar: first the surface event, then the reports of waves in the mesosphere, then the analysis of ionospheric disturbances. Knowing that chain helps you read the news with context, rather than treating each report as an isolated curiosity.
What to Watch for Next
AWE may have finished its data collection, but the field that opened when the ISS detected atmospheric waves is just getting started. The data will be analysed for years, and new instruments are already being planned or flown that will build on what AWE learned.
One question researchers want to answer is how much of the ionosphere’s day-to-day variability comes from below versus from above. AWE showed that the below part is significant. The next step is to quantify it: on a quiet solar day, how much of the disturbance is due to weather? On a stormy solar day, does the weather signal get swamped, or does it still show through? Those answers will shape the next generation of space weather models.
Another question is about prediction. Can a gravity wave observed at the mesopause be used to forecast an ionospheric disturbance minutes or hours later? If so, the ISS approach could become part of an operational forecasting system, not just a research tool. That would be a major step, turning a scientific discovery into a service. It would build directly on the nights the ISS detected atmospheric waves.
A third question is about climate. Gravity waves help drive the circulation of the middle atmosphere, and that circulation affects how heat and trace gases move around the planet. As the climate changes, storm patterns will change too, and that will change the waves. Understanding that link is part of understanding the climate system as a whole.
Finally, there is the question of what else is up there. AWE and NIRAC revealed dynamics over weather fronts that had not been studied before. There may be other wave types, or other instabilities, waiting in the same data. The history of this field suggests that when you build a better instrument and point it at the sky, you find things you did not expect. The ISS did exactly that, and the next instrument may do it again.
Final Thoughts
When the ISS detected atmospheric waves, NASA found more than a pretty pattern in the sky. It found proof that Earth and space are connected in a way that is direct, measurable, and practical. A hurricane in Florida can ripple the air 88 kilometres above it. A volcano in the South Pacific can launch waves that circle the globe. A thunderstorm in Texas can shake the mesosphere in a pattern no two storms share.
The station found those things because it was in the right place with the right tools: AWE watching airglow four times a second, NIRAC capturing the OH layer in sharp detail, astronauts photographing the patterns with their own eyes, and SAGE-III tracking the aftermath of eruptions. Together, they turned a faint glow into a global dataset, and a dataset into a new understanding of space weather. None of it would exist without the vantage point from which the ISS detected atmospheric waves.
The next time you hear about a hurricane, a tornado outbreak, or a volcanic eruption, remember that the story does not end at the ground. It continues upward, through layer after layer of air, until it reaches the edge of space. The ISS is up there watching it happen, one ripple at a time. That is the lesson the ISS detected atmospheric waves left behind.
Read Also: Lake Natron: Tanzania’s Red Lake and Flamingo Haven (2026)
