
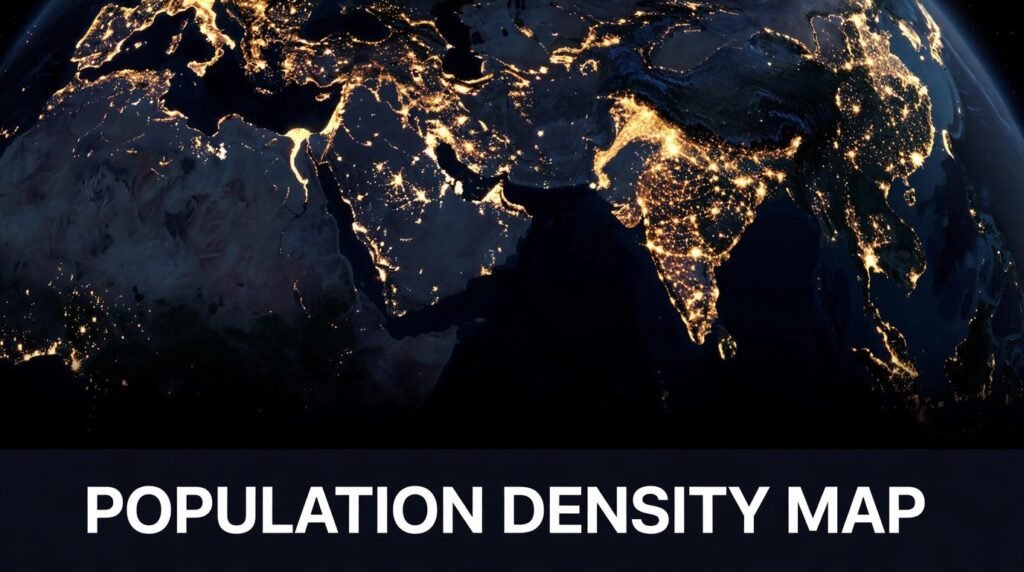
Look at Earth from space at night and you do not see countries. You see light. Tight knots of gold cluster around river deltas and coastlines, long glowing lines follow highways and railways, and huge dark stretches sit in between where almost nobody lives. A population density map is the daytime version of that same idea: a picture that shows not just how many people live somewhere, but how tightly they are packed together.
That one difference changes everything. The countries with the most people are not the most crowded ones. A small city-state can be far denser than a giant nation, and a huge empty county can hide a single packed city inside it. Once you know how to read a population density map, you start seeing the world differently. You understand why roads, hospitals and power grids go where they do, why some places feel crowded while others feel endless, and why two places with the same number of people can look nothing alike.
In this guide, you will learn what a population density map actually shows, how the numbers behind it are made, the five main styles you will come across, and how satellites now map people from orbit. You will also learn the traps, because these maps are easy to misread, and the mistakes are the interesting part.
The short answer: A population density map shows how many people live in each unit of area, usually people per square kilometre or square mile. Darker or warmer colours mean more people packed into the same space, while pale or empty areas mean few people live there. The map is built from census counts and satellite data, and it answers a different question from a plain population map. Not “how many people live here?” but “how crowded is it here?”
What Is a Population Density Map?
A population density map is a type of thematic map. Instead of showing roads, borders or rivers, it shows a single theme: how crowded each part of an area is. Every patch of colour on the map stands for a density value, which is simply the number of people divided by the land area they live on.
Think of it like this. Imagine two towns. Town A has 10,000 people living in 10 square kilometres. Town B also has 10,000 people, but they are spread across 100 square kilometres. On a normal population map, both towns look the same, because both hold 10,000 people. On a population density map, Town A glows dark and Town B looks pale, because Town A is ten times as crowded. That is the whole point of the map. It shows pressure on space, not just headcount.
Density in Plain Words
Density is always a ratio. The formula is simple: population divided by land area. If 50,000 people live in an area of 25 square kilometres, the density is 2,000 people per square kilometre. Change either number and the density changes. A town can grow denser because more people move in, or because its boundary shrinks, even if nobody new arrives.
Most maps use people per square kilometre, and maps made for American audiences often use people per square mile. One square mile is about 2.59 square kilometres, so a density of 1,000 people per square kilometre is roughly 2,590 people per square mile. Always check the unit in the legend before you compare two maps, because the same place can look very different when the unit changes.
What the Colours Actually Show
On most population density maps, colour does the talking. Pale yellows and light greens usually mean low density. Oranges and reds mean medium to high density. Deep reds, purples or near-black mean very high density. But colour alone tells you nothing until you read the legend. One map might colour anything above 1,000 people per square kilometre dark red, while another reserves dark red for places above 10,000. The same city can look extreme on one map and ordinary on another, simply because the person who made the map chose different breaks between the colour bands.
That is why the legend is the first thing to read, not the last. It tells you the range each colour covers, the unit of measurement, and often the year the data comes from. A map without a visible legend is a picture, not a tool.
How Is Population Density Calculated?
The maths is easy. Getting the numbers right is the hard part. Population density needs two ingredients: how many people live in an area, and how big that area is. Both are harder to pin down than they sound.
Population counts usually come from a census, the official count a government carries out every few years. Between censuses, statisticians update the figures with birth and death records, migration estimates and surveys. In places without a recent census, the numbers may be modelled rather than counted, and the map should say so.
Land area is trickier. Do you count the whole administrative area, including lakes, mountains and parks where nobody lives? Or only the land people can actually live on? Most density figures use total land area, which is why a region with a huge empty desert inside it can look sparsely populated even when its towns are crowded. Some newer maps adjust for this by counting only settled or built-up land, which gives a fairer picture of how crowded daily life really feels.
The year matters too. Populations move. A map built on data from 2010 will miss a decade of growth in a fast-growing city, and a map from last year may already be out of date in a place where a new housing estate has just opened. Good maps always print the data year somewhere on the page.
The 5 Main Types of Population Density Maps
Not all population density maps work the same way. Five styles dominate, and each one suits a different job. Knowing which style you are looking at stops you from drawing the wrong conclusion.
1. Choropleth Maps
The choropleth is the classic style and the one you will see most often. Each administrative area, such as a country, state or county, is filled with a single colour based on its average density. It is simple, clean and easy to read at a glance, which is why textbooks and news articles love it.
The weakness is that the colour covers the whole area evenly, even when the people inside it are not spread evenly at all. A large county with one crowded city and miles of empty farmland gets a single middle colour that describes neither the city nor the farmland. Cartographers call this the choropleth trap, and it is the most common way these maps mislead.
2. Dot Density Maps
A dot density map places one dot for a set number of people, often one dot per 100 or 1,000 people, scattered across the map where people actually live. Dense areas fill up with dots until they merge into a solid mass. Empty areas stay blank. The result looks organic, almost like a photograph of settlement itself.
The strength is honesty about empty space. The weakness is precision. The dots are placed randomly within each area rather than at real addresses, so you cannot use the map to find out exactly where a particular group of people lives. It shows the pattern, not the addresses.
3. Dasymetric Maps
A dasymetric map tries to fix the choropleth trap by using extra information, such as land cover, to refine where people are placed. If satellite imagery shows that half a county is forest or water, the map puts no people there and concentrates the colour on the settled land instead. The result is a much more realistic picture of where people actually are.
This style is more accurate, but it takes more work and better data. You will mostly find it in research papers and planning documents rather than in newspapers.
4. Cartograms
A cartogram distorts geography on purpose. Each area is resized so that its size on the page matches its population or density, not its land area. A small but crowded place balloons outward, while a huge empty region shrinks to a sliver. The shape of the map becomes strange, but the message becomes impossible to miss.
Cartograms are brilliant for showing imbalance at a glance, and terrible for navigation. You would never use one to find your way around. Use one when you want to feel the weight of the numbers rather than measure them.
5. Heat Maps
A heat map drops the boundaries altogether and paints a smooth gradient across the page, glowing brightest where people cluster most tightly. Modern heat maps are usually built from satellite data and mobile phone signals, and they can show density changing smoothly across a city, street by street.
Heat maps look beautiful and feel intuitive, but they hide their workings. The smooth glow is the result of statistical smoothing, and two heat maps of the same city can look different depending on how the smoothing was done. Treat them as an impression, not a measurement.
| Map type | Best for | Main weakness |
|---|---|---|
| Choropleth | Quick country or state comparisons | Hides uneven settlement inside each area |
| Dot density | Showing where people actually cluster | Dots are placed randomly, not at real homes |
| Dasymetric | Accurate planning and research | Needs detailed land-cover data |
| Cartogram | Showing imbalance at a glance | Geography is distorted beyond recognition |
| Heat map | Smooth city-level patterns | Smoothing choices change the picture |
How Satellites See Where People Live
For most of history, population maps depended on censuses, and censuses are slow. A country might count its people once a decade, and the results take years to publish. Satellites changed that. From orbit, human settlement leaves traces that a sensor can read: city lights at night, rooftops, roads, and fields.
The most famous of these traces is the night-lights image. NASA’s Black Marble project stitches together images from the VIIRS sensor aboard the Suomi NPP satellite, producing a picture of Earth after dark. Where the lights are bright and dense, people are many. Where the land is dark, few people live there. The Nile valley is a perfect example: a thin ribbon of light winding through darkness, because almost everyone in Egypt lives close to the river.
Night lights are a clue, not a count. A brightly lit industrial zone can hold few residents, and a poor neighbourhood can be dense yet dim. So researchers combine the lights with other data. Projects such as the Gridded Population of the World, LandScan and WorldPop blend census figures with satellite imagery, elevation, roads and land cover to estimate how many people live in each small grid cell, often as small as one square kilometre. The result is a population density map that can be updated far more often than a census allows, and that works even in places where no recent census exists.
This is also why population density maps matter to astronomy and space science. The same satellite fleet that watches the stars and the weather watches our own planet too. The view from orbit is what makes a modern population density map possible, and it is the reason the night side of Earth has become one of the most recognisable images in science.
How to Read a Population Density Map
Reading one of these maps well takes about a minute, and it is worth doing in the right order. Start with the legend, then the scale, then the patterns.
First, read the legend and note the unit. Is it people per square kilometre or per square mile? What range does each colour cover? A map with five colour bands is telling a simpler story than one with ten, and both are fine as long as you know which one you are reading.
Second, check the date and the source. Census data from five years ago is still useful for a country, but it can be badly wrong for a booming suburb. The source line, usually in small print at the bottom, tells you whether the numbers were counted, estimated or modelled.
Third, look for the big patterns before the details. Where are the dark clusters? Do they follow rivers, coasts and flat land? Where are the empty spaces, and do they match deserts, mountains or dense forest? The pattern usually tells a story about geography before it tells a story about people.
Fourth, compare like with like. A city and a country should never be compared on the same scale, and a map of one region cannot be judged against a map of another unless both use the same colour breaks. If you want to compare two places fairly, find a single map that shows both.
Finally, ask what the map leaves out. Does it count only residents, or does it include workers who commute in during the day? Does it show where people sleep, or where they spend their time? A business district can look empty on a residential density map and packed on a daytime one. Both maps are correct. They are just answering different questions.
The Most Crowded Places on Earth
Density records belong to small places. Countries with huge populations, such as India and China, are not the densest, because their people are spread across enormous land areas. The densest places are almost always small, urban and coastal.
| Place | Rough density | Why it is so dense |
|---|---|---|
| Macau | Around 21,000 people per sq km | Tiny territory, almost entirely built up |
| Monaco | Around 19,000 people per sq km | A city-state smaller than many parks |
| Singapore | Around 8,000 people per sq km | Island nation, planned high-rise living |
| Hong Kong | Around 7,000 people per sq km | Steep hills push building upward |
| Bangladesh | Around 1,100 people per sq km | The densest large country, fed by river deltas |
Cities tell the same story at a smaller scale. Manila in the Philippines is often cited as one of the most densely populated cities in the world, with some districts holding tens of thousands of people per square kilometre. Dhaka in Bangladesh and Mumbai in India are close behind. Manhattan, the most crowded borough of New York City, holds roughly 28,000 people per square kilometre, which is denser than many whole countries.
These figures are approximate, and they shift as boundaries and counting methods change. The point is not the exact number. It is the scale of the difference. The gap between the densest and the emptiest inhabited places on Earth is measured in thousands, not in small steps.
Why Some Places Are Empty
A population density map is also a map of emptiness, and the empty places have their own logic. People cluster where life is easiest: near fresh water, on flat land, in mild climates, and close to coasts and rivers. They thin out where those things are missing.
Deserts are the clearest example. The Sahara covers a huge part of North Africa, yet almost everyone in the region lives along its edges or in the Nile valley. Siberia is vast and cold, and most of Russia’s population lives in the milder west. The Australian Outback is enormous and dry, and the great majority of Australians live in a handful of coastal cities. Greenland, the world’s largest island, has a population smaller than many small towns, because ice covers most of it.
Mountains, dense forests and high latitudes work the same way. They do not forbid settlement, but they make it harder, and over centuries people have voted with their feet. A population density map makes that long, slow vote visible in a single image.
What Population Density Maps Get Wrong
These maps are useful, but they are easy to misread, and three mistakes come up again and again.
The first is the average trap. A single density figure for a large area hides everything inside it. A county with an average of 100 people per square kilometre might contain a city of 10,000 per square kilometre and farmland with almost nobody. The average describes neither. Whenever a number covers a large area, ask what is hiding inside it.
The second is the boundary trap. Density depends on where you draw the line. A city measured tightly around its built-up core looks far denser than the same city measured with its suburbs included. Two cities can swap places in a ranking simply because one was measured with a generous boundary and the other was not. This is why rankings of the “most crowded city” often disagree with each other. They are usually measuring different things.
The third is the colour trap. Our eyes are drawn to dark colours, so a map with dramatic reds can make a place look more crowded than it is. A mapmaker who chooses narrow colour bands at the top end can make a modest city look extreme, while wide bands can make a crowded one look calm. The colours are a choice, not a fact. The legend is the fact.
Where These Maps Are Used in Real Life
Population density maps are working tools, not just classroom posters. City planners use them to decide where new schools, hospitals and bus routes should go. A neighbourhood that is dark red on the map probably needs more services than a pale one, and the map shows that at a glance.
Emergency services use them too. When a flood, earthquake or wildfire threatens an area, responders need to know how many people are in the danger zone, not just how big the zone is. A density map turns an area on a map into a number of people who may need help, which decides how many rescue teams and shelters are sent.
Public health teams use them to plan vaccination campaigns and track how diseases spread, because crowded places spread infections faster. Businesses use them to choose shop locations, and to decide where delivery networks and warehouses make sense. Even astronomers care: a dark-sky site for a telescope has to be far from the bright clusters on the night-lights map, because light pollution ruins the view of the stars.
How to Make Your Own Population Density Map
You do not need expensive software to make one. The data is free, and the tools are too. A simple version takes an afternoon.
Start with data. The Gridded Population of the World dataset is free to download and covers the whole planet. WorldPop offers finer detail for many countries, and NASA’s Earthdata portal gives access to the Black Marble night-lights images. For a single country, the national statistics office usually publishes census tables by region, and those are the most authoritative figures you will find.
Then pick a tool. QGIS is free, open-source mapping software that can turn a table of numbers into a choropleth map in a few steps: load a boundary file, join your population table to it, calculate density, and choose a colour scale. If you prefer to work in a browser, Google Earth Engine lets you explore the same satellite datasets without downloading anything.
Keep the design honest. Use a colour scale that your readers can follow, label the unit clearly, print the data year and the source, and choose boundaries that match your question. A map of a city should use small areas such as neighbourhoods or wards, not whole counties, or the choropleth trap will swallow the detail you care about. Then check your work against a second source. If your map disagrees wildly with a published one, find out why before you trust it.
Frequently Asked Questions
What is a population density map in simple terms?
It is a map that shows how crowded different places are. Instead of showing how many people live in a place, it shows how many people live in each square kilometre or square mile of that place. Darker colours mean more people packed into the same amount of space.
What is the difference between population and population density?
Population is the total number of people in a place. Population density is that number divided by the land area. A huge country can have a large population and a low density, while a tiny city can have a small population and a very high density. The two numbers answer different questions.
Which country has the highest population density?
Among larger countries, Bangladesh is usually the densest, at roughly 1,100 people per square kilometre. Among all territories, the small city-states of Macau and Monaco are far denser, at around 19,000 to 21,000 people per square kilometre, because almost all of their land is built up.
How do satellites measure population density?
Satellites do not count people directly. They record the traces people leave: city lights at night, rooftops, roads and farmland. Researchers combine those traces with census data to estimate how many people live in each small area. NASA’s Black Marble night-lights images are one of the best-known sources for this kind of work.
What is the most densely populated city in the world?
It depends on how the city boundary is drawn, which is why rankings disagree. Manila in the Philippines is very often near the top, with some districts holding tens of thousands of people per square kilometre. Dhaka and Mumbai are also among the most crowded large cities on Earth.
Why are some areas on a population density map completely empty?
Usually because of geography. Deserts, ice caps, high mountains and dense forests make settlement difficult, so few people live there. Sometimes the emptiness is man-made, such as a national park, a military area or a large reservoir, where nobody is allowed to live at all.
Can I trust a population density map I find online?
Mostly yes, if you check three things: the source, the date and the legend. Maps from national statistics offices, NASA and established research projects are reliable. Be cautious with maps that hide their source, use no date, or use dramatic colours without explaining what the colours mean.
Final Thoughts
A population density map is a simple idea with a surprising amount of depth. One number, people divided by area, turns into a picture of how humanity actually arranges itself: clustered along rivers and coasts, stacked into towers where land is scarce, and absent from the deserts, ice and mountains that cover so much of the planet.
The map is only as honest as the person who made it, though. Read the legend first, check the date and the source, and remember that an average can hide a crowded city inside an empty county. Do that, and a population density map becomes one of the most useful pictures in geography. It shows you, in a single glance, where people are, where they are not, and why.
Read Also: Alien Covenant Cast: Who Stars in the 2017 Sci-Fi Film
1 Comment